Combining AI and Finance An End-to-End Earnings Call Analysis Using Gemini and Python
Introduction
Earnings calls are pivotal moments when companies share their quarterly or annual results. Investors, analysts, and the media rely on these calls to gauge corporate performance and market outlook. With recent advances in AI and natural language processing, we can now automate much of this analysis, extracting detailed sentiment, emotion, and even forward-looking signals from both the text and audio of these calls.
In this blog post, we’ll walk through a notebook that demonstrates how to:
- Fetch and store corporate earnings call transcripts (and audio) from a specialized library.
- Perform sentiment and emotion analysis on transcripts and call audio using Google’s GenAI (Gemini).
- Compare sentiment to stock price movements retrieved via the
yfinanceAPI. - Visualize how post-earnings returns align with negative or positive sentiments.
- Generate investment recommendations grounded by external web search data.
By the end, you’ll see how AI can assist in turning unstructured conversation data into actionable insights.
1. Setting Up the Environment
First, the notebook handles installing a few key Python packages:
!pip install --upgrade earningscall
!pip install yfinance --upgrade --no-cache-dir
!pip uninstall -qqy jupyterlab
!pip install "jupyterlab>=3.1.0,<4.0.0a0"
!pip install -U -q "google-genai==1.7.0"
!pip install json-repair
earningscall: A specialized library to retrieve corporate earnings call data (transcripts, audio).yfinance: An easy-to-use wrapper for Yahoo Finance for historical stock prices.google-genai: For accessing Google’s large language models (Gemini) within Python.json_repair: To fix malformed JSON if the language model’s response deviates from the strict schema.
Upgrading and removing libraries avoids version conflicts, especially on notebook platforms like Kaggle.
2. Imports and Basic Setup
Several libraries are imported:
import json, pytz, time, enum
import pandas as pd
import seaborn as sns
import yfinance as yf
from tqdm import tqdm
from google import genai
from google.genai import types
from collections import Counter
import matplotlib.pyplot as plt
from google.api_core import retry
from json_repair import repair_json
from earningscall import get_company
from pydantic import BaseModel, Field
from datetime import timedelta, datetime
from typing import List, Optional, Literal
from kaggle_secrets import UserSecretsClient
from IPython.display import display, Markdown
Key points:
tqdmprovides progress bars for loops.pydanticenforces structured responses from the AI model.google.api_core.retryautomatically retries Gemini API calls if they run into rate limits or transient issues.
2.1. Authenticating with Gemini
GOOGLE_API_KEY = UserSecretsClient().get_secret("GOOGLE_API_KEY")
client = genai.Client(api_key=GOOGLE_API_KEY)

is_retriable = lambda e: (isinstance(e, genai.errors.APIError) and e.code in {408, 429, 503})
genai.models.Models.generate_content = retry.Retry(predicate=is_retriable)(genai.models.Models.generate_content)
- Grabs an API key securely stored in Kaggle Secrets.
- Wraps the
generate_contentcall with a retry strategy for error codes408,429, and503.
3. Getting the Earnings Call Data
The library earningscall makes it simple to fetch events for a specific company’s ticker:
ticker_symbol = 'AAPL'
company = get_company(ticker_symbol)

ts = {}
afs = {}
quarters = []

for event in company.events():
    if datetime.now().timestamp() < event.conference_date.timestamp():
        # skip future events
        continue

    year, quarter = event.year, event.quarter

    # Retrieve transcript and audio, store them in dicts
    transcript = company.get_transcript(year=year, quarter=quarter)
    ts[(year, quarter)] = transcript.text

    audio_file = company.download_audio_file(year=year, quarter=quarter,
                                             file_name=f"Apple Q{quarter} {year}.mp3")
    afs[(year, quarter)] = audio_file

    quarters.append((year, quarter))
Here’s what happens:
- Look up Apple (AAPL) and list all historical earnings call events.
- Filter out future calls (no reason to fetch data for an upcoming earnings release).
- Download transcript text (storing in
ts) and download audio (afs). - Keep track of each
(year, quarter)in a list namedquartersfor later loops.
4. Analyzing Sentiment with Gemini
4.1. Single and Comparative Transcript Sentiment
We define a short prompt to label transcripts as Positive, Neutral, or Negative. We also compare consecutive transcripts (e.g. Q1 vs. Q2) to see if the sentiment improved or worsened.
sents = {}
comps = {}
prev_transcript = None

for (year, quarter) in quarters:
    transcript = ts[(year, quarter)]

    # Single transcript classification
    prompt = f"Classify transcript as POSITIVE, NEUTRAL or NEGATIVE.\n{transcript}\nSentiment: "
    response = client.models.generate_content(
        model='gemini-2.0-flash',
        config=types.GenerateContentConfig(response_mime_type="text/x.enum", response_schema=Sentiment),
        contents=prompt
    )
    sents[(year, quarter)] = response.text

    # Compare to previous quarter
    if prev_transcript:
        comparison_prompt = f"Compare two transcripts and classify second as POSITIVE, NEUTRAL or NEGATIVE..."
        response = client.models.generate_content(...)
        comps[(year, quarter)] = response.text

    prev_transcript = transcript
Here, the key is response_schema=Sentiment, which instructs Gemini to only output valid strings from our Sentiment enum (POSITIVE, NEUTRAL, or NEGATIVE). If Gemini attempts to output something else, it should raise a validation error.
4.2. Audio Sentiment Analysis
For audio, the notebook:
- Uploads the
.mp3file to Gemini, - Prompts the model: “Classify audio as POSITIVE, NEUTRAL or NEGATIVE.”
auds = {}
for (year, quarter) in quarters:
    myfile = client.files.upload(file=f"Apple Q{quarter} {year}.mp3")
    prompt = "Classify audio as POSITIVE, NEUTRAL or NEGATIVE.\nSentiment: "
    response = client.models.generate_content(
        model="gemini-2.0-flash",
        config=types.GenerateContentConfig(...),
        contents=[prompt, myfile]
    )
    auds[(year, quarter)] = response.text
5. Detailed Emotion and Utterance Analysis
Sometimes, you want deeper insights: exactly which speaker is positive or negative, and why. This section instructs Gemini to produce a JSON structure containing an utterance-by-utterance breakdown:
from pydantic import BaseModel, Field
from typing import List, Literal

class Utterance(BaseModel):
    speaker: str
    utterance: str
    sentiment: Literal["Positive","Negative","Neutral"]
    emotion: str | None
    reasoning: str

class OverallAnalysis(BaseModel):
    overall_sentiment: Literal["Positive","Negative","Neutral"]
    notable_shifts: str | None
    relationship_dynamics: str | None

class ConversationAnalysis(BaseModel):
    utterances: List[Utterance]
    overall_analysis: OverallAnalysis

# ...
zero_shot_prompt = """
*You are provided with a transcript...
Output Format:
{
  "utterances": [...],
  "overall_analysis": {...}
}
"""
response = client.models.generate_content(
    model="gemini-2.0-flash",
    contents=[zero_shot_prompt, myfile],
    config={
        'response_mime_type': 'application/json',
        'response_schema': ConversationAnalysis,
    }
)
auds_detailed[(year, quarter)] = response
This chunk:
- Prompts the model to parse each speaker’s line,
- Classifies that line with both a sentiment and optional emotion tag,
- Summarizes the overall conversation’s sentiment and key changes.
6. Grounded Recommendations
Before wrapping up the sentiment pipeline, the notebook also does an example of a grounded query with a minimal prompt:
def query_with_grounding(year, quarter):
    response = client.models.generate_content(
        model='gemini-2.0-flash',
        contents=f"""
What is the recommendation (buy, sell, or hold) based on {ticker_symbol}'s {year} Q{quarter} earnings call?
""",
        config=types.GenerateContentConfig(
            tools=[types.Tool(google_search=types.GoogleSearch())],
        ),
    )
    return response
Gemini is allowed to access the google_search tool so it can gather real-world context—such as recent analyst opinions, news, or data—when forming a recommendation.
7. Stock Returns Calculation
yfinance is used to fetch historical price data for up to 7 years (period='7y'). The code then calculates returns for multiple intervals after each earnings call:
def calculate_returns(earnings_dates, stock_data, horizons):
    results = []
    for dt in earnings_dates:
        # find next trading day, get that closing price
        # compare it to future closes 1 day, 1 week, etc. later
        # store as a % return
    return pd.DataFrame(results)
By merging these returns with the previously extracted sentiments, we can see if calls labeled “Positive” correlate with better or worse post-call performance over the next few days or weeks.
8. Visualizing the Results
8.1. Sentiment vs. Returns
The notebook merges each quarter’s transcript sentiment (sents, comps, auds) with the calculated returns. It groups data by sentiment label and plots boxplots:
# For each sentiment set
melted_df = returns_df.melt(id_vars=['Sentiment'],
                            value_vars=[...])
sns.boxplot(x='Time Horizon', y='Return', hue='Sentiment', data=melted_df)
plt.title(...)
...
This reveals if “Positive” calls lead to higher average returns or if the market is already pricing in the news.
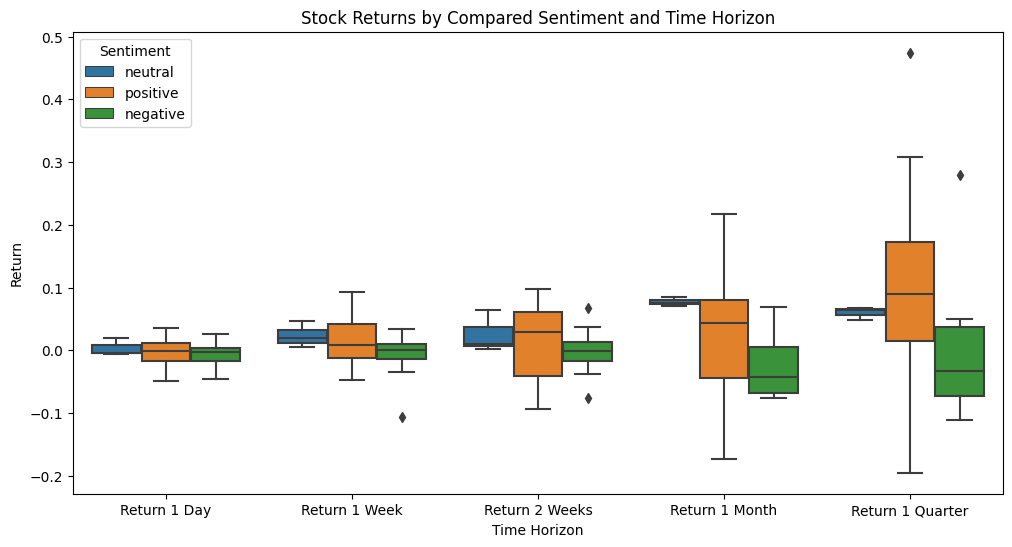
Figure: “Stock Returns by Compared Sentiment and Time Horizon”
- Overall Pattern
- The positive group (orange) is mostly shifted above zero for each horizon, suggesting that quarters classified as “more positive” relative to the prior quarter tend to have higher average returns.
- The negative group (green) hovers around or below zero and appears to have more negative outliers, implying that worsening sentiment vs. the previous quarter aligns with weaker returns.
- Wider Range in Longer Horizons
- At the 1‐Quarter mark, the distribution for positive has a couple of high outliers near or above +0.4–0.5, illustrating that some quarters produced very strong returns when sentiment turned more positive.
- Negative sentiment extends to about –0.2 on the downside, emphasizing that the market’s reaction can become more pronounced over time.
- Neutral Sentiment
- The neutral category (blue) usually lies between positive and negative. Returns bunch closer to zero, especially at shorter horizons. This suggests that no major shift in sentiment from one quarter to the next often aligns with relatively muted price reactions.
Key Insight
When transcripts are labeled “more positive” than the prior quarter, the stock’s median return is higher across all post-earnings horizons. By contrast, “more negative” or “worse” sentiment leads to lower or negative median returns.
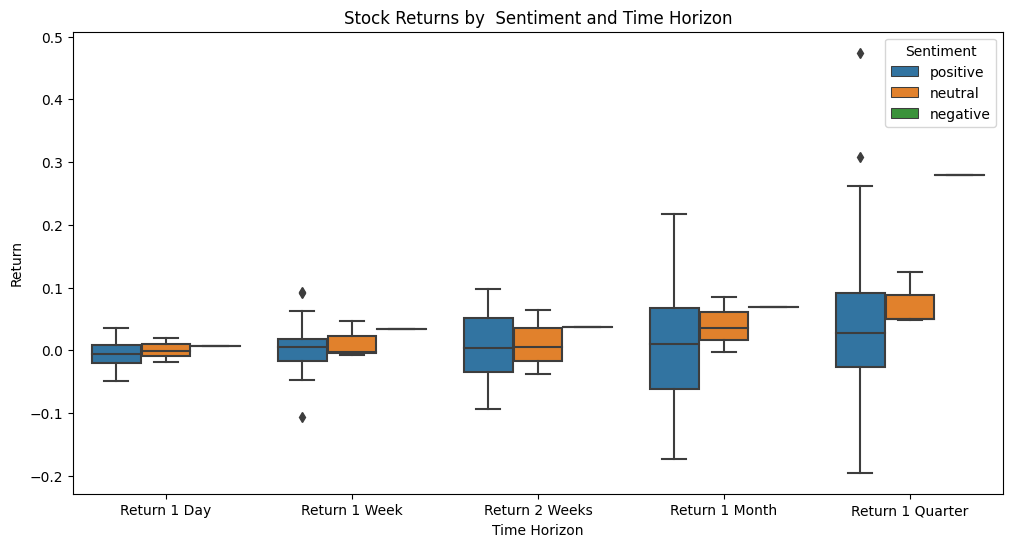
Figure: “Stock Returns by Sentiment and Time Horizon”
- Similar Story, Different Scale
- As with the “compared” approach, positive calls (blue) generally out‐perform negative calls (green).
- There is a notably large negative outlier (around –0.2) for 1‐Month returns when the transcript was classified as positive, showing that sentiment alone is not foolproof—you can still see exceptions.
- Neutral vs. Positive Spread
- For 1 Day to 1 Week, neutral (orange) and positive are relatively close, but by 1 Month or 1 Quarter the two distributions diverge more obviously.
- This implies that while the immediate price reaction (1 Day) might not be drastically different, the gap widens if the sentiment truly signals better fundamentals or stronger market reception over time.
- Outliers Show Volatility
- A few quarters have extraordinary positive or negative returns, reminding us that single events (e.g. major product releases, global news) can overshadow the sentiment classification.
Key Insight
Single‐quarter sentiment on its own correlates with subsequent returns in a similar fashion to the “compared” approach: positive classifications generally produce higher median returns; negative classifications are more likely to yield weaker or negative returns.
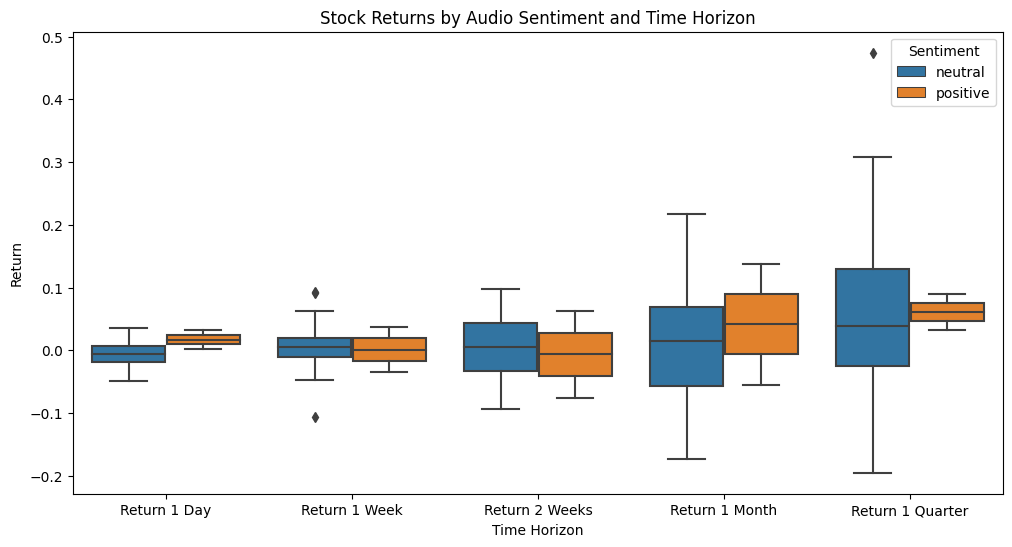
Figure: “Stock Returns by Audio Sentiment and Time Horizon”
- Fewer Classes
- Here, we see only two bars: neutral (blue) and positive (orange). There may have been no calls classified as “negative” by the audio analysis or they are omitted from the plot.
- That alone highlights differences between text sentiment vs. audio sentiment—sometimes models pick up extra cues in the human voice (enthusiasm, confidence, etc.), but they might also produce fewer “negative” classifications if the calls are typically quite polished in tone.
- Consistent Advantage for Positive
- Across 1 Day, 1 Week, 1 Month, and 1 Quarter, the positive audio label generally has higher median returns than the neutral grouping.
- At the 1‐Month and 1‐Quarter marks, the difference looks more dramatic—reinforcing the idea that bullish tone in the audio might reflect confidence from management, leading to a stronger share price response over time.
- Some Overlap and Outliers
- Neutral returns can be slightly positive or negative. Positive has one or two negative outliers, reinforcing that while sentiment from voice tone can be insightful, markets remain unpredictable and subject to broader factors.
Key Insight
Even just from the audio classification, the model’s “positive” calls align with higher median returns. The absence (or near‐absence) of “negative” labels might indicate how corporate earnings calls are usually delivered in a measured, upbeat manner.
Overall Observations
-
Positive Sentiment ≈ Higher Median Returns
In all three approaches (compared transcripts, single transcripts, and audio sentiment), the calls labeled “positive” see consistently higher medians over multiple return windows. -
Negative / Worsening Sentiment ≈ More Risk, More Downside
When the model detects negative or worsening sentiment, returns often cluster below zero and can have significant downside outliers. -
Longer Horizons Amplify the Difference
1‐Day returns might not diverge dramatically by sentiment category—some calls remain near zero or modest. However, at 1‐Month or 1‐Quarter, we often see bigger gaps emerge. This suggests either the news/optimism eventually resonates in the market, or negative signals compound over time. -
Audio vs. Text
Audio classification might pick up additional nuances (tone, inflection), but the sample also shows fewer negative results. In practice, it’s common for management to maintain a professional, positive tone even when fundamentals are not strong. Text transcripts, especially Q&A sections, might reveal more explicitly negative content. -
Caution: Outliers
Several large positive or negative moves highlight that external market dynamics—broader economic news, sector rotation, geopolitical events—can overshadow the sentiment classification from a single call.
These three figures illustrate that earnings‐call sentiment does show a general relationship with future returns, particularly over longer horizons. In real-world trading or forecasting, one would combine these signals with other data (like macro conditions, peer analysis, or fundamentals) to reduce the impact of outliers and improve overall predictive power.
8.2. Emotions vs. Returns
The “detailed conversation analysis” portion also collects the percentage of negative vs. positive emotions. The code then merges:
# Summarize negative emotions in a single "Emotion_Negative" column
df['Emotion_Negative'] = df[negative_emotion_columns].sum(axis=1)

merged_df = pd.merge(df, returns_df, on='Period')
Finally, a dual-axis plot shows how negative sentiment or negative emotion lines up with subsequent returns:
fig, ax1 = plt.subplots()
ax1.plot(..., merged_df['Sentiment_Negative'])
ax2 = ax1.twinx()
ax2.plot(..., merged_df[f"Return {horizon}"])
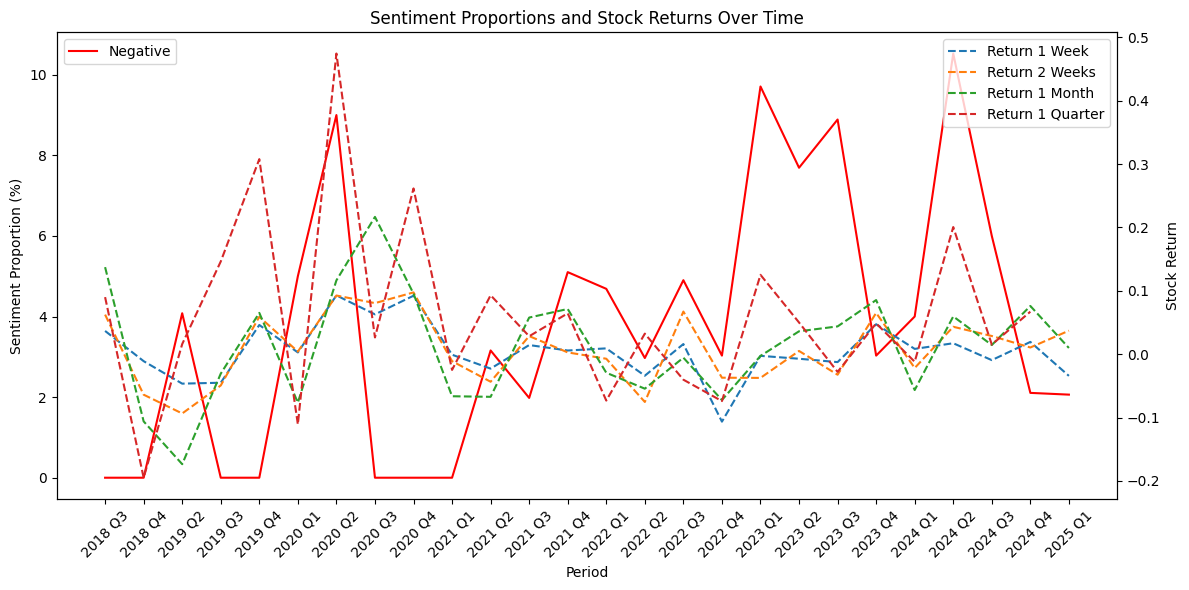
Figure: “Sentiment Proportions and Stock Returns Over Time”
What the Plot Shows
- On the left y-axis: the negative sentiment proportion (in red), expressed as a percentage of all utterances.
- On the right y-axis: a set of dashed lines indicating forward returns (1 Week, 2 Weeks, 1 Month, 1 Quarter) following each earnings call.
Key Observations
- Spiky Negative Sentiment
- There are distinct spikes at certain quarters (e.g., around 2019 Q4, 2020 Q2, 2023 Q2), where negative sentiment jumps from near 0% up to 8–10%.
- These spikes could be tied to particularly cautious or critical commentary on the call, macro uncertainty, or company‐specific news.
- Inconsistent Relationship with Returns
- After some peaks in negative sentiment, returns are indeed lower (below 0) for one or more time horizons, suggesting that negative remarks on the call could foreshadow or coincide with weaker performance.
- However, there are also times where negative sentiment is elevated but returns remain near or above zero (e.g., around 2023 Q1–Q2). This underlines that other market forces (e.g., broader economic factors, product cycles) can offset negativity in the call.
- Gradual vs. Immediate Impact
- The 1-Day or 1-Week returns might not drop every time negative sentiment spikes—sometimes the effect shows up more at the 1-Month or 1-Quarter mark. This could indicate a delayed market response, or that traders and analysts weigh other data (like guidance or macro trends) before fully pricing in a negative call tone.
Takeaway
There is a general sense that higher negative sentiment correlates with weaker forward returns, but it’s far from perfect. Large spikes in negativity often coincide with below‐zero returns, yet there are periods where negativity or caution from management does not lead to price declines, highlighting the market’s complexity.
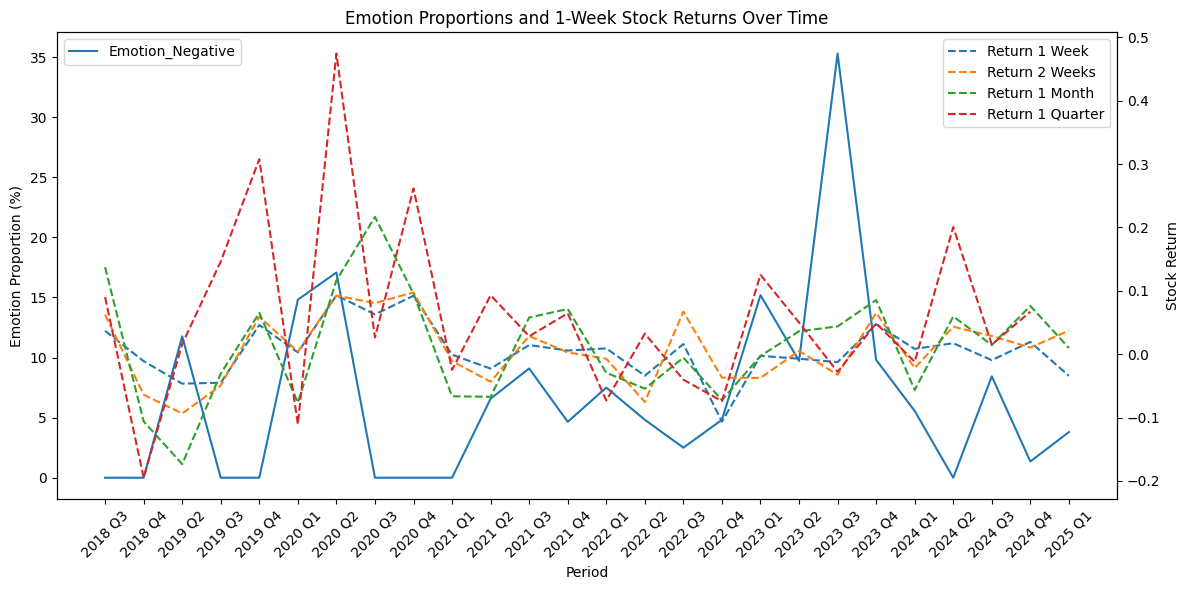
Figure: “Emotion Proportions and Stock Returns Over Time”
What the Plot Shows
- On the left y-axis: the negative emotion proportion (blue line), which aggregates specific emotions (e.g., fear, anxiety, frustration).
- On the right y-axis: again, dashed lines for 1 Week, 2 Weeks, 1 Month, and 1 Quarter returns.
Key Observations
- Volatility in Negative Emotions
- The proportion of negative emotions can swing dramatically from near 0% to over 30% in certain quarters. These extremes might indicate moments when the conversation explicitly discussed major risks, supply chain disruptions, or macroeconomic threats.
- Some quarters have practically no negative emotion, suggesting a rather optimistic or neutral tone from management and analysts during that period.
- Possible Alignment with Major Events
- High negative emotion spikes are seen around 2020 Q2 (the onset of COVID‐19’s market impact) and again around 2023 Q2. Notably, broader economic or global events often coincide with strong negative emotional language in earnings calls (concerns about uncertainty, demand, etc.).
- Overlap with Returns
- There are quarters where negative emotions rise sharply and the subsequent returns (especially over 1 or 2 weeks) dip below zero.
- In other quarters, the negative emotion proportion spikes, yet the returns remain mostly positive. This suggests that while emotional tone can be telling, investors and analysts may still see underlying resilience or future growth drivers, limiting any short‐term selloff.
- Longer‐Term vs. Shorter‐Term
- The 1‐Quarter return line (dotted red) often shows larger swings than the 1‐Week or 2‐Week lines. This can amplify the eventual impact of negative emotion if it is tied to deeper operational or macro issues that take time to manifest.
Takeaway
Emotion analysis (especially “negative” feelings such as worry or frustration) can highlight when management or analysts are explicitly concerned about headwinds. Sometimes those concerns coincide with weaker returns in subsequent weeks or months, but the market reaction is not guaranteed—other upbeat factors (like strong product announcements) can offset negative emotional cues.
Overall Insights
- Negative Signals vs. Other Drivers
- Although we do see some correlation between heightened negativity/negative emotion and weaker returns, there is no one‐to‐one mapping. Company earnings calls are only one source of market information. Broader economic indicators and unexpected news can override the tone of the call.
- Short‐Term vs. Long‐Term Effects
- In many examples, immediate (1‐Day or 1‐Week) returns do not always match the level of negativity. Over longer horizons (1 Month or 1 Quarter), the gap sometimes widens. This implies the market’s initial reaction might be muted, with negativity unfolding later or being exacerbated by subsequent events.
- Different Types of ‘Negative’
- Sentiment negativity in transcripts is often about performance or outlook, while “negative emotion” picks up on more subjective expressions (fear, sadness, worry). Each measure can spike for different reasons—and thus align with returns differently.
- Context Matters
- Spikes in negativity during periods of global turbulence (e.g., pandemic, supply‐chain crises) might be partly “priced in” already. The call transcripts could reflect that negativity, but the market may have anticipated those headwinds.
- Value of Qualitative + Quantitative
- These plots illustrate the benefit of combining quantitative returns with qualitative textual/emotional signals. Even if they don’t always coincide perfectly, noticing a sudden rise in negative emotion proportion or negative sentiment can prompt deeper investigation into company fundamentals or macro concerns.
Ultimately, sentiment analysis of earnings calls—whether focusing on negative vs. positive language or deeper emotional cues—can provide helpful signals. In practice, you would combine these signals with fundamental analysis, macroeconomic context, and industry‐wide comparisons to determine whether negativity is a short‐term hiccup or indicative of a more persistent challenge.
9. Reviewing the AI’s Recommendations
The last cell uses display(Markdown(t)) to print out each recommendation from the “grounded search” step. This might look like:
“We recommend a Buy for Apple’s Q1 2025 results due to strong iPhone and services revenue.”
This approach merges numeric analysis with large language model interpretability—giving users a short, intuitive summary of how that quarter’s performance fits into a broader market context.
Over the span of multiple quarters from 2018 through 2025, Apple (AAPL) consistently delivered strong revenue and EPS figures, though certain periods showed missed forecasts or slower smartphone sales (particularly in China). Most analyst ratings gravitated toward a “Buy” or “Moderate Buy” recommendation, often grounded in Apple’s robust services growth, emerging-market performance, healthy capital return programs, and optimism surrounding new products (e.g., the latest iPhones or AI initiatives). While a minority of analysts occasionally advocated “Hold” or “Sell” in response to premium valuations or specific market weaknesses, the broad consensus leaned positive, with average price targets typically exceeding Apple’s then-current trading price.
Conclusion
This notebook demonstrates how to build an end-to-end AI pipeline around corporate earnings calls:
-
Data Collection
Automate fetching transcripts and audio for each earnings period. -
Sentiment & Emotion
Use large language models (Gemini) to classify textual transcripts and raw audio into fine-grained emotions. -
Quantitative Market Impact
Align these sentiment signals with future returns, letting you investigate correlations or causal patterns. -
Recommendations with External Knowledge
Harness a “grounded” model call that references external data for more informed decisions.
All of these steps can be adapted to different tickers or extended to more sophisticated analyses—like comparing sentiment to analyst revisions, or emotions to options market implied volatility. As generative AI continues to evolve, these types of pipelines will become even more powerful tools in investment research and corporate intelligence.
Ready to apply these insights to your own dataset?
- Swap out the
ticker_symbolto another company, - Expand your horizons or add more advanced text analytics,
- Experiment with cross-sectional analysis of multiple tickers.
And, of course, always keep an eye on data integrity and how your modeling assumptions influence the results. By coupling domain expertise with robust data pipelines, we can derive more reliable insights from earnings calls and enhance the speed, scale, and depth of financial analysis.