Two-Speed Reset, Not A Full Risk-Off Collapse
Market Summary, Prediction, and Outlook
Executive summary
As of 2026-07-18, the market regime is best described as a two-speed reset rather than a full risk-off breakdown. CNN article frames Asia’s rally through the lens of record highs in Taiwan, South Korea, and Japan after the March drawdown, while Yahoo Finance article reframes the latest selloff as a Kimi K3 / “DeepSeek-flashback” valuation shock to crowded AI trades. The combination implies a key shift: the medium-term AI upcycle is still intact, but near-term positioning, valuation, and capex payback assumptions are being repriced more aggressively. Reuters market wrap · TSMC Q2 earnings · ASML Q2 results
The most important cross-asset message is internally consistent. U.S. equities rolled over led by semiconductors; Asia followed, with Taiwan and Japan hit hardest; oil rose sharply on renewed U.S.-Iran escalation; Treasury yields eased from their highs even as some Fed officials sounded hawkish; the dollar finished the week broadly steady to weaker; and gold stabilized on the day but remained down over the past month. This is a growth/valuation shock plus geopolitical inflation hedge, not yet a disorderly macro panic. VIX closed at 18.77, materially higher on the day but still below classic crisis levels. Reuters market wrap · Reuters Nikkei report · Taiwan News · Cboe VIX
The policy backdrop remains mixed rather than uniformly restrictive. U.S. June CPI cooled to 3.5% YoY and 2.6% core, while the June FOMC minutes showed that inflation risks remained tilted upward because of energy, tariffs, and AI-related demand. Outside the U.S., the ECB raised rates by 25 bps in June, and the BOJ shifted the overnight call-rate target to around 1.0%, keeping the global rates backdrop less supportive than in a typical mid-cycle dip-buying phase. U.S. BLS CPI · Federal Reserve minutes · ECB decision · BOJ decision
My base interpretation is unchanged from the earlier Chinese report: the AI fundamental story has not broken, but the market has entered a more fragile second stage in which leadership broadens, index upside slows, and crowded AI-beta becomes more sensitive to earnings quality, oil, and central-bank communication. TSMC and ASML both reported strong Q2 results and constructive outlooks, which argues against a collapse in real semiconductor demand; the current drawdown is more consistent with multiple compression and positioning stress than with a hard demand recession. TSMC Q2 earnings · ASML Q2 results · Reuters market wrap
Synthesis of source triangulation
The accessible public framing for the CNN piece emphasizes that Taiwan, South Korea, and Japan had recently set fresh highs after bouncing back from March weakness. That framing is directionally important because it shows the present drawdown is coming after an exceptionally strong Asia-led AI rally, not from depressed positioning. In other words, the market entered July with momentum, crowded winners, and elevated expectations. The Yahoo Finance article adds the second leg of the story: Moonshot AI’s Kimi K3 revived investor fears that AI economics may become more competitive, more open-weight, and harder to monetize at the margin. Reuters reported that Moonshot presented Kimi K3 as a very large open-weight system with performance close to a frontier U.S. model, intensifying an already ongoing semiconductor-led selloff. Reuters market wrap · Yahoo Finance · CNN
This matters less as a single-product event than as a trigger for re-rating the scarcity premium embedded in AI infrastructure and software winners. When triangulated with primary and official sources, the picture becomes clearer. TSMC reported Q2 revenue up 36.0% YoY, net income up 77.4%, and said Q3 should be supported by continued strong demand for leading-edge process technologies. ASML reported €9.3 billion in Q2 sales and raised its 2026 sales outlook to €43–45 billion. Those releases do not support the thesis of immediate demand destruction; they support the thesis of a market that had become too one-sided and too valuation-dependent. TSMC Q2 earnings · ASML Q2 results
At the macro layer, the market is being forced to reconcile three facts at once: cooling headline inflation in the U.S., lingering upside inflation risk from oil and conflict, and a still-firm AI capex cycle. The June U.S. CPI release showed the largest monthly all-items decline since April 2020, largely because energy fell sharply month on month, but the Fed minutes still highlighted risks from strong AI demand, Middle East conflict, and tariffs. That combination explains why bond yields slipped while equities still sold off: investors de-risked equity duration more than macro recession. U.S. BLS CPI · Federal Reserve minutes · Reuters market wrap
Liquidity and positioning also matter. Reuters reported that foreign investors sold $137.36 billion of Asian equities in the first half of 2026, the fastest such six-month outflow in LSEG data going back to 2010, with South Korea and Taiwan accounting for the largest amounts. That does not mean a structural rejection of Asia, but it does mean that profit-taking and crowding were already powerful before this latest July downdraft. Reuters Asia fund flows
Key market moves
All market levels below are as of 2026-07-17 close unless noted. One-month comparisons use the nearest referenced close around 2026-06-18.
Major indices
| Market | Close | 5D move | ~1M move | Volume / turnover | Volatility note |
|---|---|---|---|---|---|
| S&P 500 | 7,457.69 | -1.55% | -0.57% | 5.30B shares | VIX at 18.77, +12.19% on the day |
| Dow Jones | 52,146.42 | -0.93% | +1.13% | 549.69M shares | More resilient than Nasdaq |
| Nasdaq Composite | 25,520.24 | -2.90% | -3.76% | 1.58B shares | SOX entered bear-market territory |
| TAIEX | 42,671.27 | n/a | -8.17% | NT$1.21tn trade value | Electronics led downside |
| Hang Seng | 24,562.24 | +1.60% | +2.66% | 3.75B shares | China-tech rotation cushioned prior week |
| Nikkei 225 | 64,141.12 | -6.44% | -9.73% | n/a | 11.3% below Jun. 25 record |
| Shanghai Composite | 3,764.15 | n/a | -7.98% | 65.05B shares | Weak tape despite PMI re-expansion |
Sources and calculation basis: S&P 500, Dow, Nasdaq, and weekly moves are from the July 17 Reuters market wrap; VIX is from Cboe; TAIEX close and turnover are from Taiwan market reports; Hang Seng and Shanghai closes/volumes are from historical market data; Nikkei is from Reuters and Nikkei Indexes. One-month returns are calculated from the referenced June and July closes. Reuters market wrap · Cboe VIX · Taiwan News · Hang Seng data · Reuters Nikkei report · Nikkei Indexes · Shanghai data
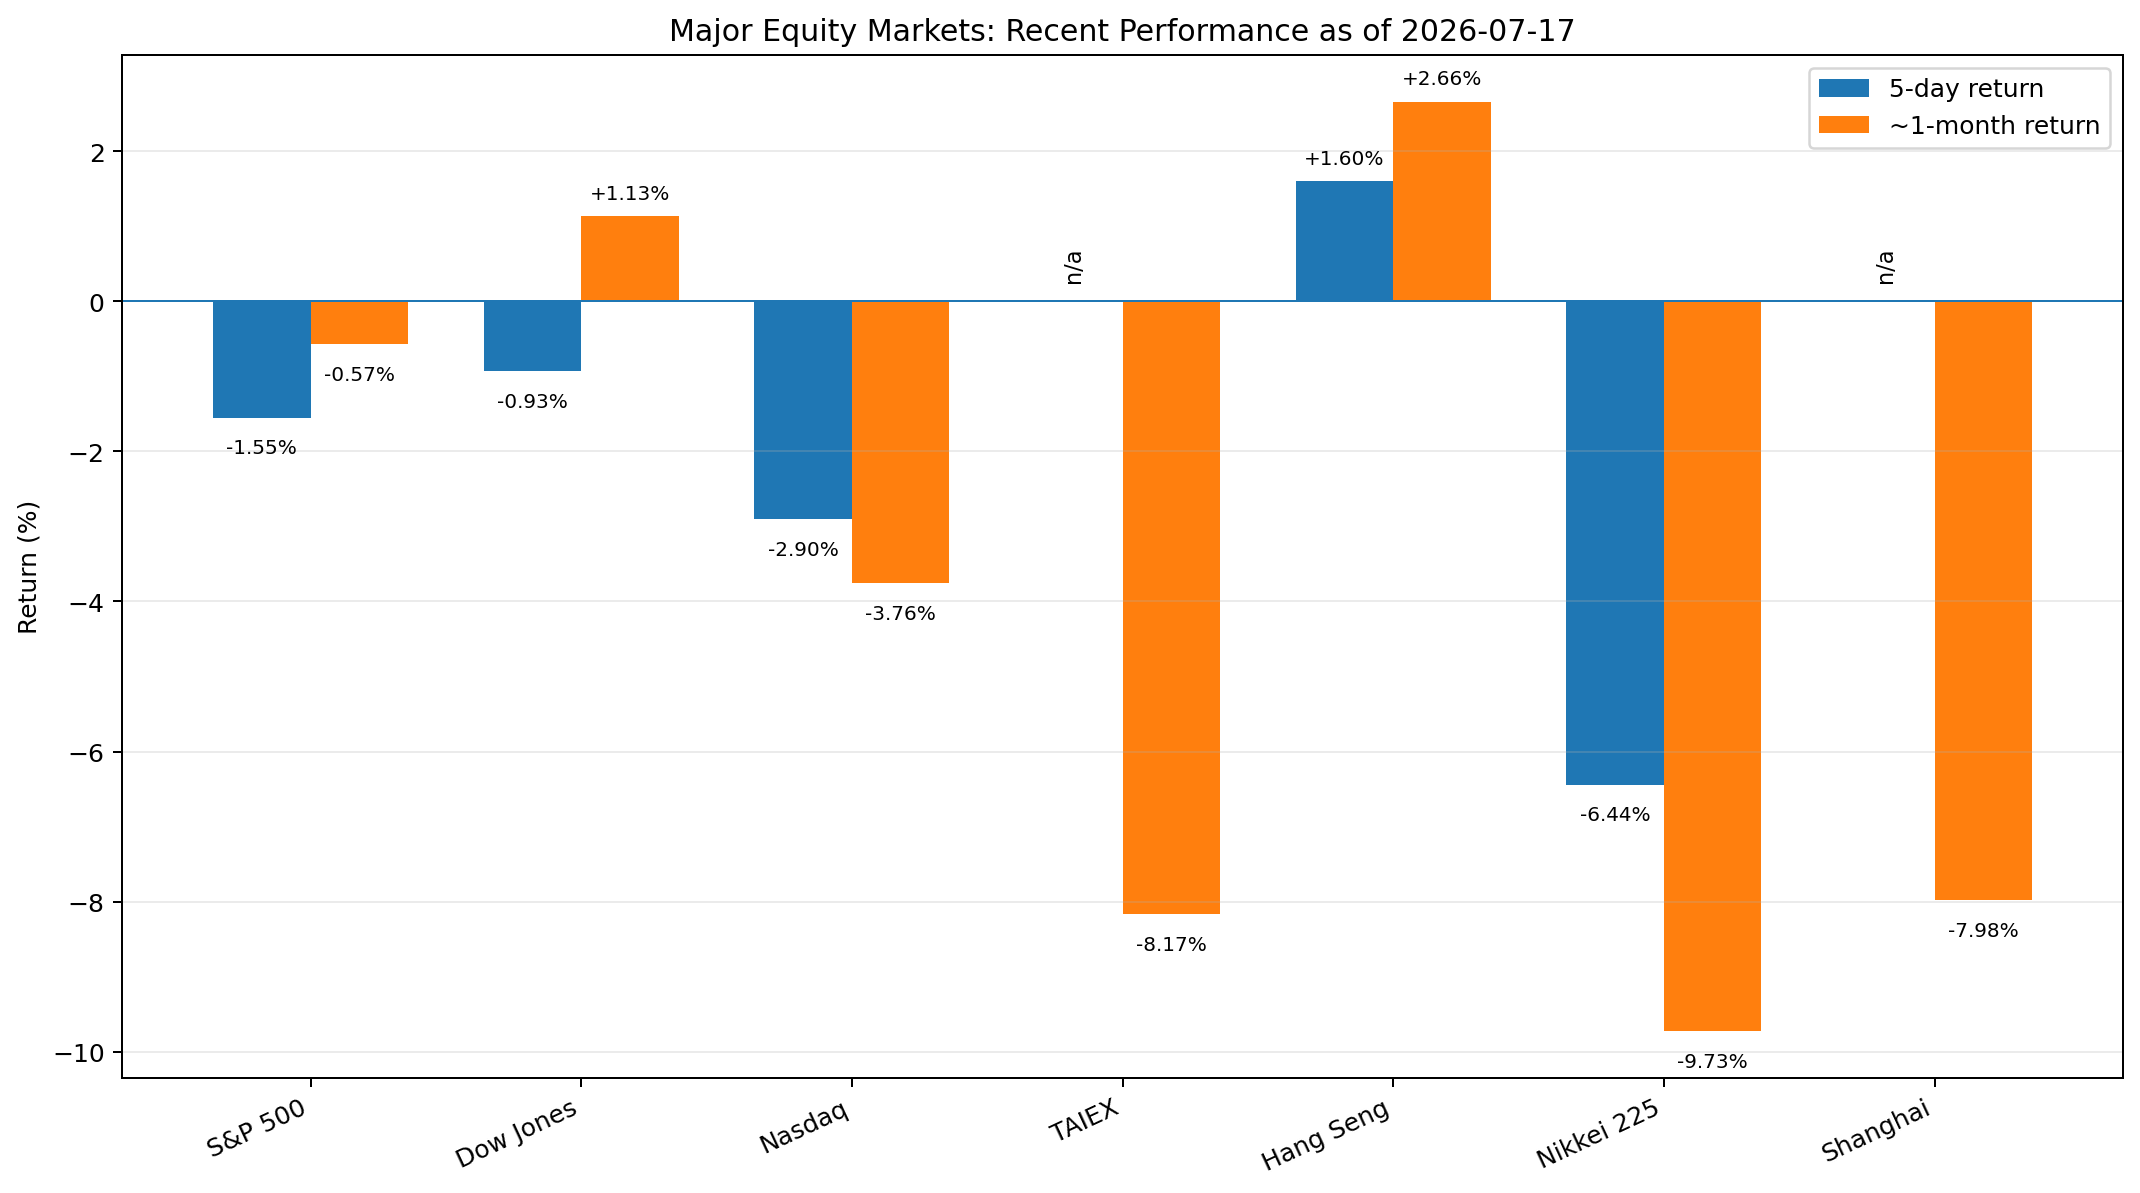
Generated chart from the cited July 17 closes and referenced 5D/1M comparison points. Reuters market wrap · Taiwan News · Hang Seng data · Reuters Nikkei report · Shanghai data
FX and commodities
| Asset | Latest | 1W / 5D signal | ~1M move | Read-through |
|---|---|---|---|---|
| DXY | 100.76 | -0.2% for the week | -0.09% | Dollar firm intraday, softer on cooling CPI |
| EUR/USD | 1.1437 | +0.2% for the week | -0.16% | ECB hawkishness offset by U.S. risk-off demand |
| USD/JPY | 162.43 | broadly firmer USD | +0.64% | Weak yen keeps Japan inflation/rates debate alive |
| USD/TWD | 32.4090 | higher on the day | +2.48% | TWD weakened with tech and offshore risk reduction |
| Brent | $88.10/bbl | sharply higher on the week | +10.32% | Geopolitics reintroduced inflation risk |
| Gold | $4,009–4,017/oz | rose on the day | -4.59% | Still pressured by higher real-rate fears |
Sources and calculation basis: The July 17 levels and weekly direction for DXY, EUR/USD, USD/JPY, Brent, and gold are from Reuters; one-month changes use the referenced historical comparison points. Reuters market wrap
Sector leaders, laggards, and heat
On July 17, Energy was the only S&P 500 sector in the green, while tech and AI-linked names carried the downside. Same-day market leaderboards showed Travelers (+9.22%), Seagate (+5.66%), and Centene (+3.99%) among the top gainers, while Intuitive Surgical (-14.15%), Cadence (-9.47%), Synopsys (-7.85%), and Netflix (-7.26%) were among the worst performers. That pattern is consistent with a rotation away from expensive growth duration and AI beta toward defensives, insurers, and energy-linked exposure. Reuters market wrap · Economic Times market movers
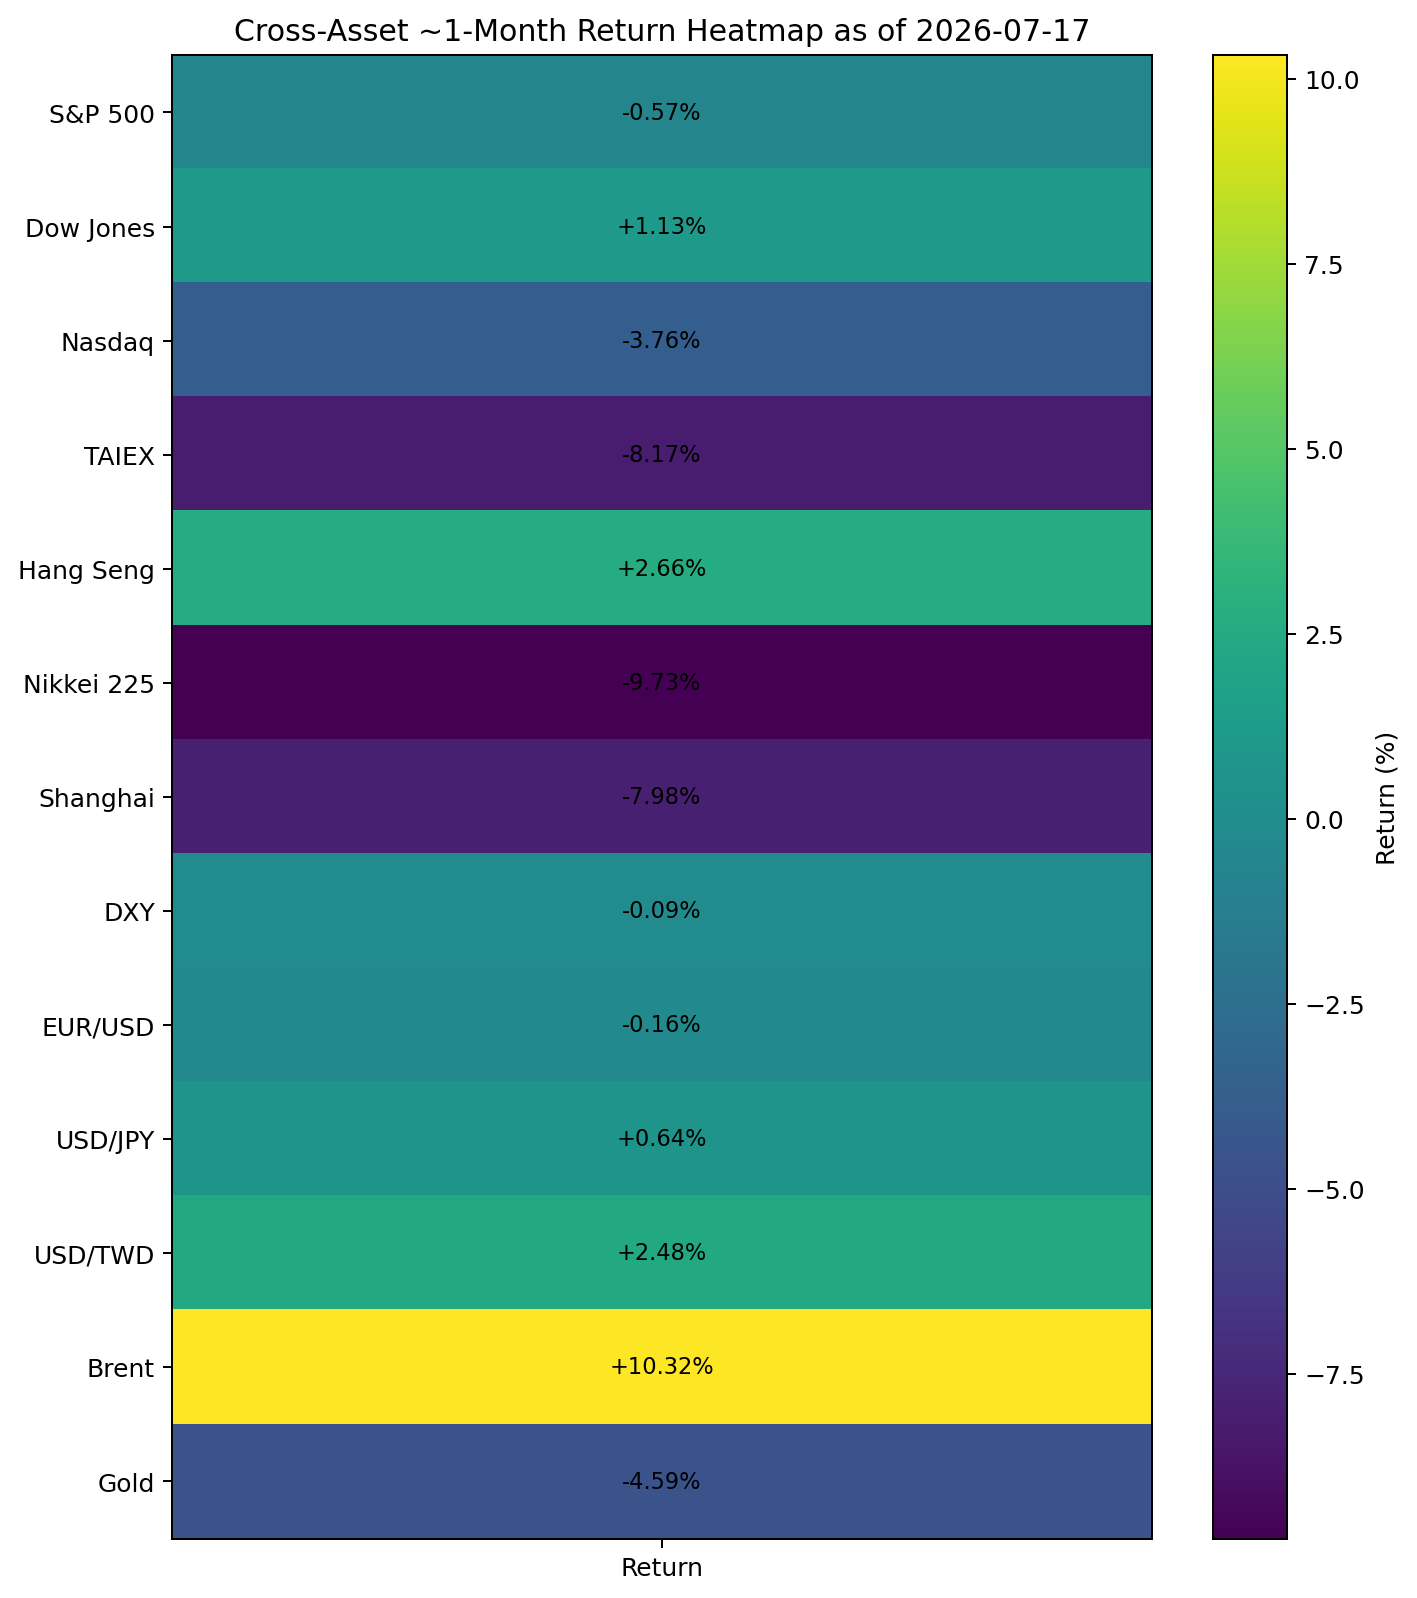
Generated heatmap of the latest directional move profile across major indices and major cross-asset channels, based on the cited daily and recent-period market data. Reuters market wrap · Taiwan News · Hang Seng data · Reuters Nikkei report · Shanghai data
Drivers and causal map
The macro driver set is led by rates and inflation uncertainty, not by a collapse in activity. U.S. June CPI slowed to 3.5% YoY and core CPI to 2.6%, helped by a 5.7% monthly drop in energy, but the Fed’s June minutes still highlighted upside inflation risks from AI-related demand, Middle East conflict, and tariffs. This is a divided rates narrative rather than a settled easing cycle. U.S. BLS CPI · Federal Reserve minutes
Outside the U.S., monetary policy is not uniformly easing. The ECB on June 11 raised its three key policy rates by 25 bps, taking the deposit facility to 2.25%. The BOJ on June 16 shifted its operating target to keep the uncollateralized overnight call rate around 1.0%, and its next scheduled meeting is July 30–31. That means the market is trying to de-risk AI valuations in an environment where neither Europe nor Japan is delivering an obvious fresh liquidity impulse. ECB decision · BOJ decision · BOJ meeting schedule
The activity data are mixed but not recessionary. China’s official June manufacturing PMI returned to expansion at 50.3, with the composite PMI output index at 50.6, suggesting stabilization in production and new orders. Yet Shanghai equities still fell sharply over the past month, which implies equity investors remain more concerned with valuation, policy credibility, and the external growth mix than with a single PMI print. China NBS PMI · Shanghai Composite data
Earnings have been a buffer, but not enough to offset multiple compression. TSMC and ASML both reinforced the durability of leading-edge and AI-infrastructure demand, while Reuters reported that JPMorgan, Goldman Sachs, Bank of America, and Citigroup exceeded expectations or benefited from strong trading and deal-making. At the same time, Netflix reported solid Q2 revenue and margins but guided to slower Q3 revenue growth, illustrating how even good operating results can be punished when forward growth fails to clear a high market bar. TSMC Q2 earnings · ASML Q2 results · Reuters bank-results wrap · Netflix Q2 letter
Geopolitics and liquidity are the final accelerants. Reuters reported renewed U.S.-Iran escalation, disruption around Hormuz-sensitive infrastructure, and a sharp rise in oil prices; separately, Reuters’ Asia flow data showed large first-half foreign selling in Taiwan and Korea. Together, these forces amplify drawdowns in crowded AI beneficiaries because they hit both discount rates and positioning liquidity at once. Reuters market wrap · Reuters Asia fund flows
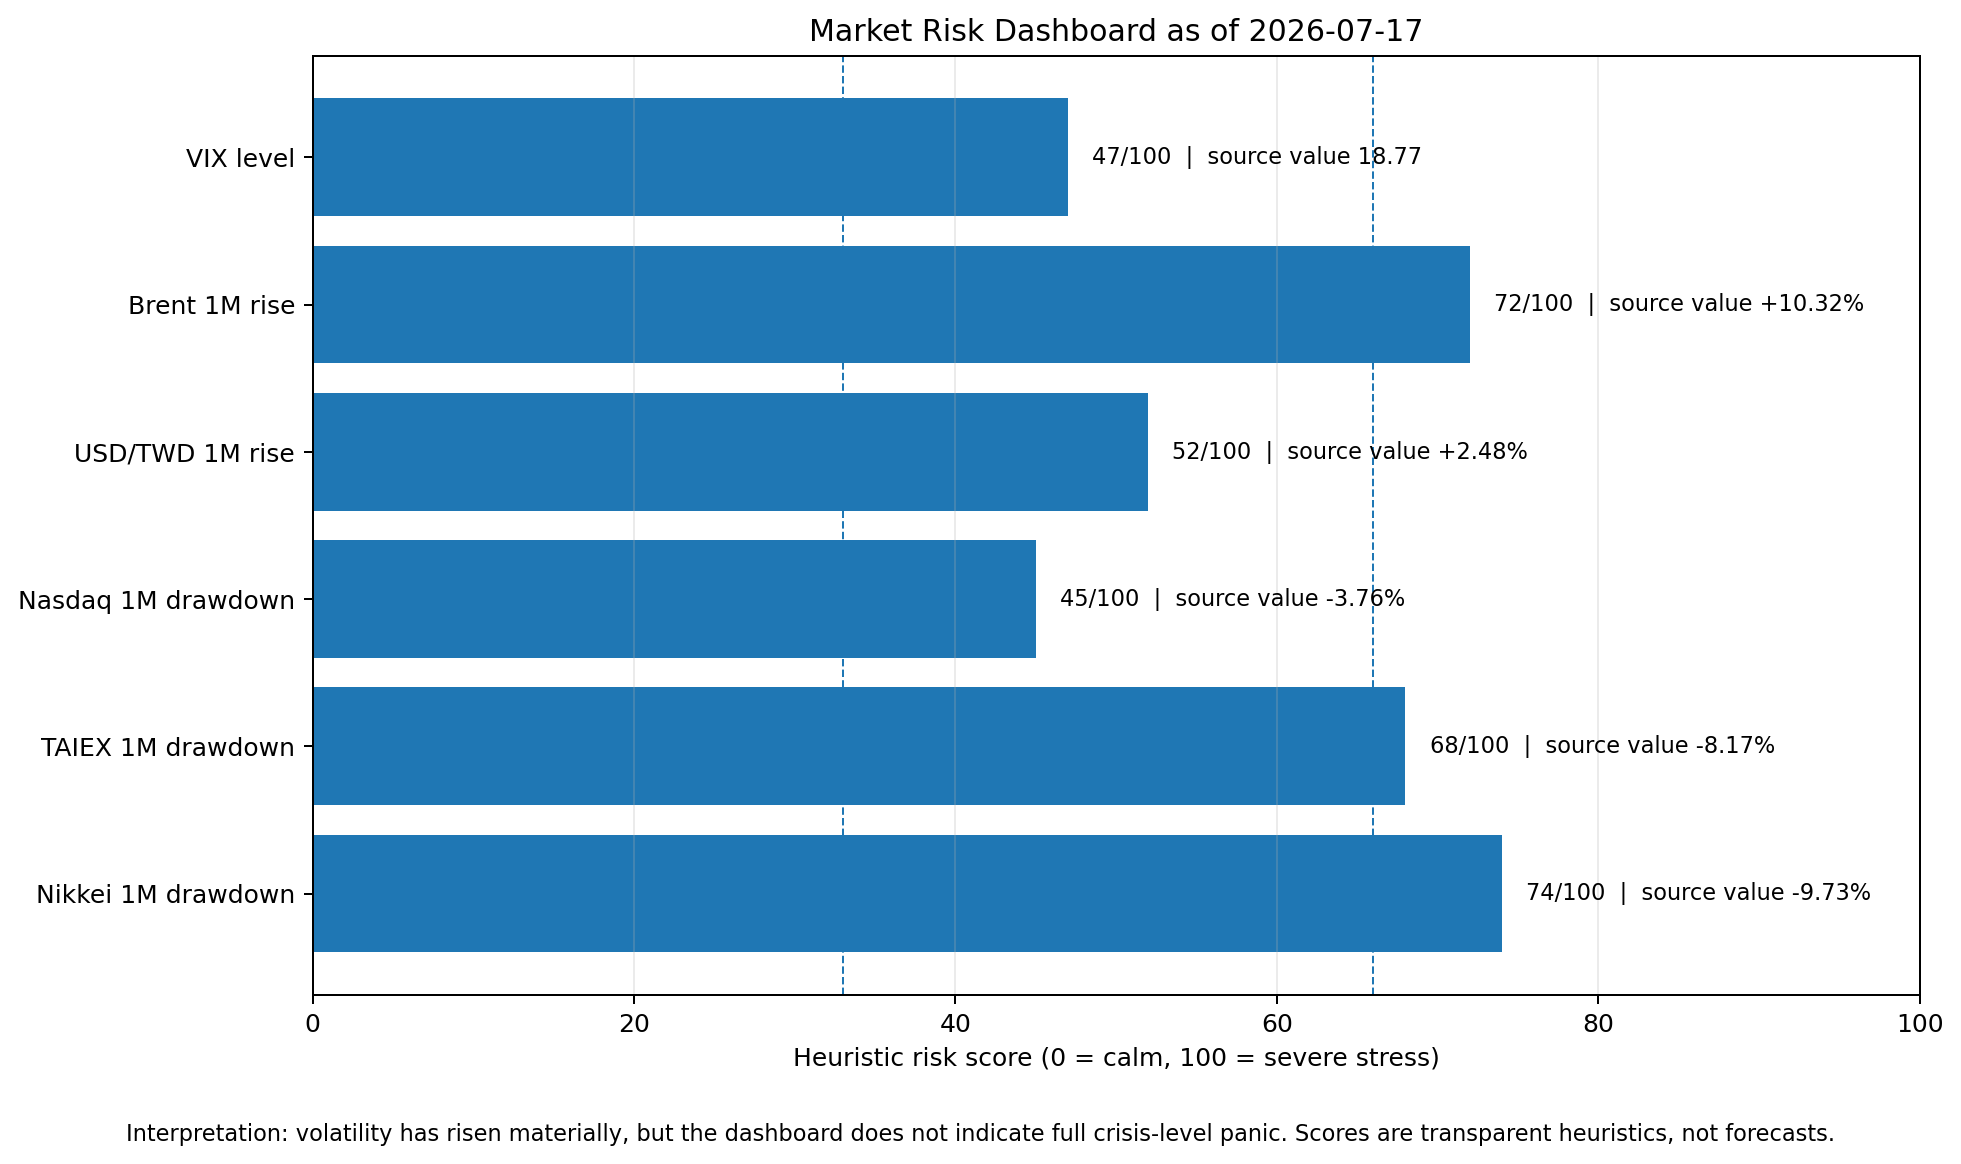
Generated heuristic risk dashboard using the cited VIX, oil, FX, and equity drawdown data. The main signal is that volatility has risen materially, but not yet into full panic territory. Cboe VIX · Reuters market wrap · Taiwan News · Reuters Nikkei report
Scenario outlook
The scenario framework below is judgmental rather than model-implied. In notation, a probability-weighted market view can be written as
\[E[R] = \sum_{i=1}^{n} p_i \cdot r_i\]where $p_i$ is scenario probability and $r_i$ is the market outcome under that scenario.
Short-term horizon
| Scenario | Probability | Core view | Key triggers | Main risks |
|---|---|---|---|---|
| Base case | 50% | Consolidation, then partial stabilization | SOX stops making new lows; Brent fails to extend far above high-80s; Fed on Jul. 28–29 and BOJ on Jul. 30–31 avoid a fresh hawkish shock | Another AI de-rating wave, oil spike, hot inflation re-pricing |
| Downside case | 25% | Broader de-risking and further multiple compression | More hawkish Fed rhetoric; oil remains elevated; weak AI/software guidance | Nasdaq and Asia underperform sharply |
| Upside case | 25% | Oversold rebound led by quality AI infra and financials | Strong earnings from bellwethers; geopolitical cooling; lower rate volatility | Rebound fades if leadership stays too narrow |
The FOMC meeting dates used in the scenario table are July 28–29, and the BOJ meeting dates are July 30–31. Federal Reserve calendar · BOJ meeting schedule
This remains the same conclusion as the earlier Chinese report: the most likely short-term path is not an immediate return to new highs, but a fragile stabilization window in which fundamentals and policy communication determine whether July’s drawdown becomes a correction or a trend break.
Medium-term horizon
| Scenario | Probability | Core view | Key triggers | Main risks |
|---|---|---|---|---|
| Base case | 45% | Range-up after digestion; leadership broadens beyond semis | AI capex stays real; breadth improves; oil stops climbing | Valuation ceiling remains lower than in H1 |
| Bull case | 35% | AI cycle re-accelerates and Asia selectively recovers | TSMC/ASML follow-through, softer oil, stable CPI/PMI | Crowding returns too quickly |
| Bear case | 20% | Inflation and geopolitics dominate; policy stays tighter for longer | Sustained Brent strength, sticky inflation, more explicit Fed/BOJ repricing | Deeper earnings de-rating, weaker liquidity |
The core medium-term message is still constructive but more selective: if AI capex remains backed by cash flow and orders, the market can recover; but the multiple investors are willing to pay is likely lower than during the earlier “everything AI” phase. TSMC Q2 earnings · ASML Q2 results · Federal Reserve minutes
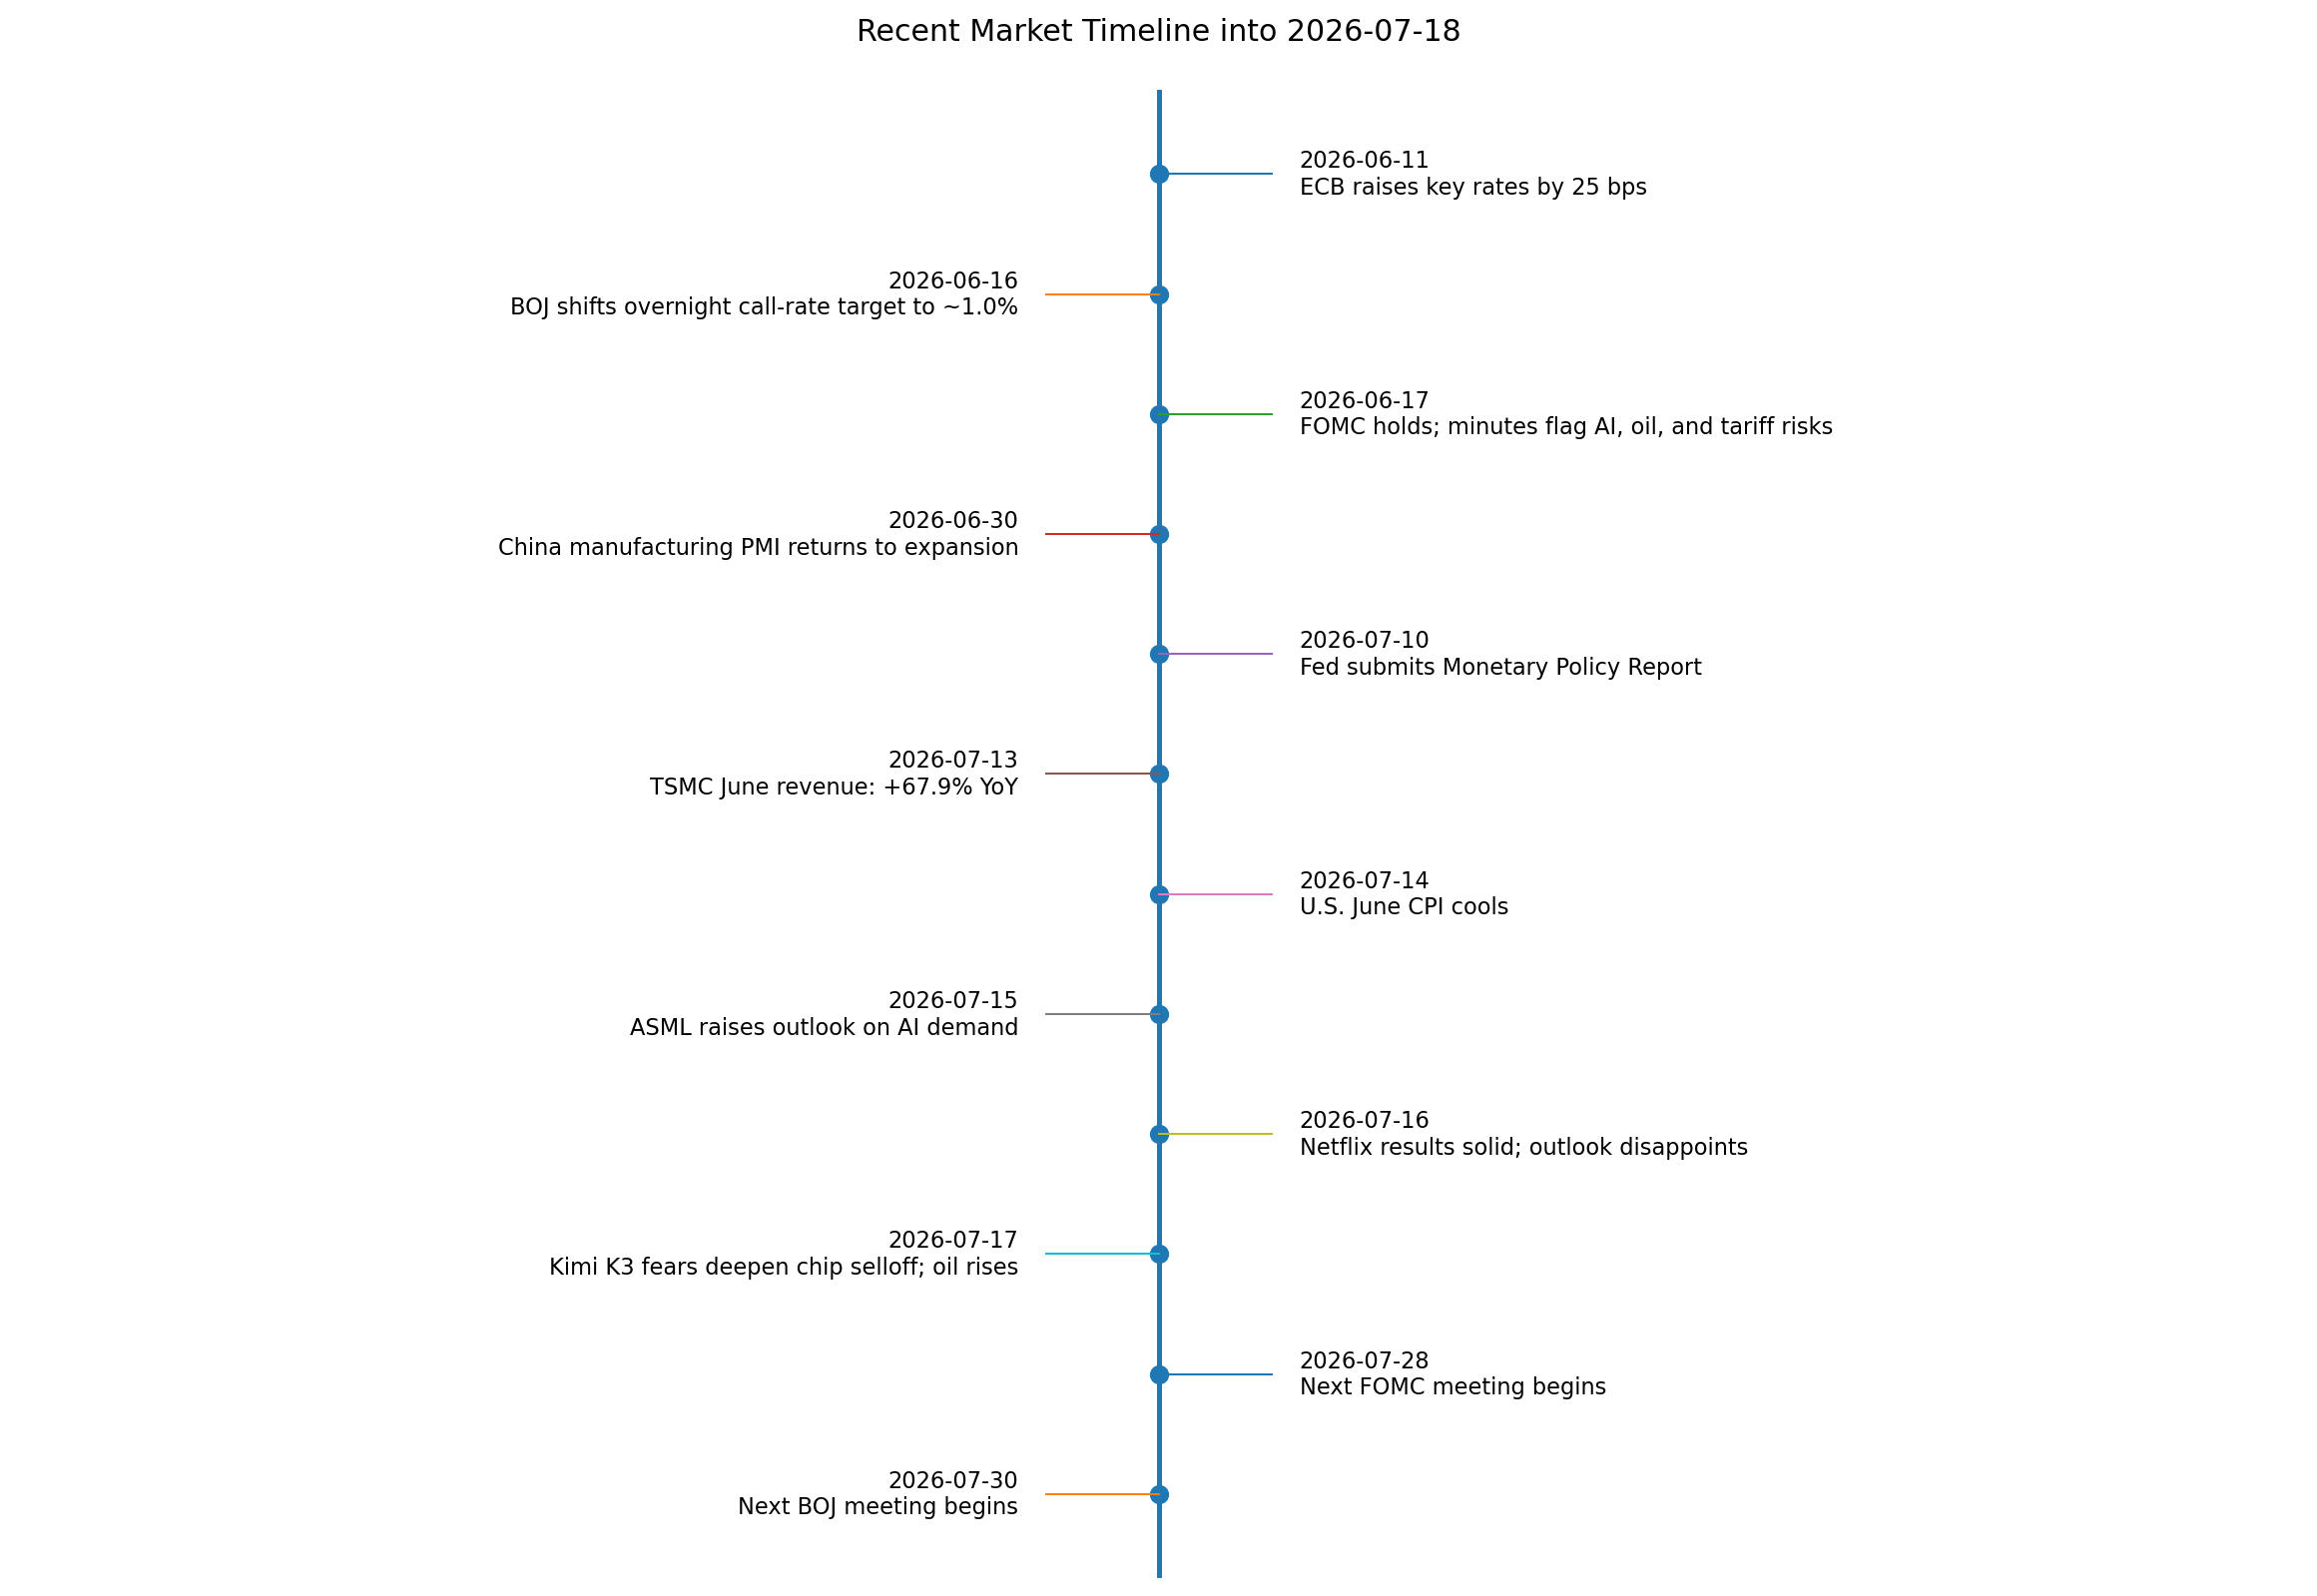
The timeline summarizes the June–July 2026 policy, macro, earnings, and market events cited throughout this report. ECB decision · BOJ decision · Federal Reserve minutes · China NBS PMI · TSMC June revenue · U.S. BLS CPI · ASML Q2 results · Netflix Q2 letter · Reuters market wrap · Federal Reserve calendar · BOJ meeting schedule
Positioning implications
For non-personalized positioning, the earlier report’s conclusion still holds: favor a barbell over a one-way AI momentum chase. That means a relative tilt toward cash-flow-generative quality, select energy exposure, and defensive compounders, while being more cautious on the most crowded AI-beta names until earnings and policy events reduce uncertainty. The rationale is straightforward: TSMC and ASML still validate the underlying capex cycle, but oil, rates, and competition headlines have shortened the market’s tolerance for expensive duration. TSMC Q2 earnings · ASML Q2 results · Reuters market wrap
For regional allocation, the implication is selective Asia rather than broad Asia beta. Taiwan and Japan remain the most sensitive to the semiconductor complex and therefore may continue to show greater near-term volatility; Hong Kong/China could outperform at the margin if investor rotation continues from AI hardware into cheaper China-tech and internet exposure, but China macro stabilization still looks only tentative. Taiwan News · Reuters Nikkei report · Hang Seng data · China NBS PMI
For hedges, the cleanest framework remains the same: use oil sensitivity, broad-equity downside protection, or FX expressions tied to policy divergence rather than relying solely on bond duration. That is because the current shock mix includes both growth scares and inflation-sensitive energy risk. In practical watchlist terms, the highest-signal assets over the next two weeks are Brent, VIX, USD/JPY, TAIEX, Nikkei, SOX, and the earnings/guidance cadence from TSMC, ASML, major U.S. banks, and additional AI bellwethers. Reuters market wrap · Cboe VIX · BOJ decision · TSMC Q2 earnings · ASML Q2 results · Reuters bank-results wrap
Sources
User-provided links
- CNN: US stocks and Asia market article
- Yahoo Finance: Kimi K3 just triggered DeepSeek flashbacks in the stock market
Primary and official sources
- Federal Reserve: FOMC meeting calendars and information
- Federal Reserve: FOMC minutes, June 16–17, 2026
- Federal Reserve: Monetary Policy Report, July 2026
- U.S. BLS: Consumer Price Index, June 2026
- ECB: Monetary policy decisions, June 11, 2026
- BOJ: Change in the Guideline for Money Market Operations, June 16, 2026
- BOJ: Monetary Policy Meetings schedule
- China National Bureau of Statistics: June 2026 PMI
- China NBS interpretation of June 2026 PMI
- TSMC: June 2026 Revenue Report
- TSMC Investor Relations: 2Q26 Earnings Release
- ASML: Q2 2026 financial results
- Netflix IR: Q2 2026 Shareholder Letter
- TWSE official homepage
- Hang Seng Indexes homepage
- Shanghai Stock Exchange English site
- Nikkei Indexes: historical data
- Cboe: VIX
Reputable news and market-data sources used for triangulation
- Reuters: World stocks fall in semiconductor rout; oil rises on Middle East escalation
- Reuters: Foreigners dump Asia stocks at record pace as AI winners get crowded
- Reuters: Stocks gain on softer inflation, bank results while oil rises
- Reuters: Japan’s Nikkei slides into correction zone
- Economic Times: U.S. stocks end lower as the chip selloff broadens
- Taiwan News: TAIEX posts largest single-day loss in history
- Investing.com: Hang Seng historical data
- Investing.com: Shanghai Composite historical data